Air Dispersion Modeling and Meteorology Input Files
Air dispersion modeling is the practice of using mathematical equations to characterize atmospheric conditions and address how pollutants emitted by a source disperse. Dispersion models require detailed inputs to produce meaningful predictions. Modeled predictions provide useful information in making decisions for permits, state implementation plans, and even air monitor siting.
Meteorological data are required to perform refined modeling. The Division provides surface meteorological data (using ADJ_U*) from twelve airports that record winds at 1-minute intervals. Surface data files are combined with upper air data from Wilmington, Nashville, Lincoln, and/or Roanoke upper air stations. The table at the bottom of this page contains zipped files of the processed meteorological data for years 2020-2024 organized by regions as shown on the maps. Maps on this page are for informational purposes only and are subject to revision or correction at any time.
Surface Meteorological Data Regions Map
The recommended Kentucky surface air station representativeness regions were determined by the Division using a review of multiple factors, including regional terrain influences, station elevation, surface/land use characteristics, distance, station siting/location, data quality, and wind direction/speed patterns from intermediary weather stations operated by the Kentucky Mesonet. The elevation of each meteorological station is listed on the map in meters (m).
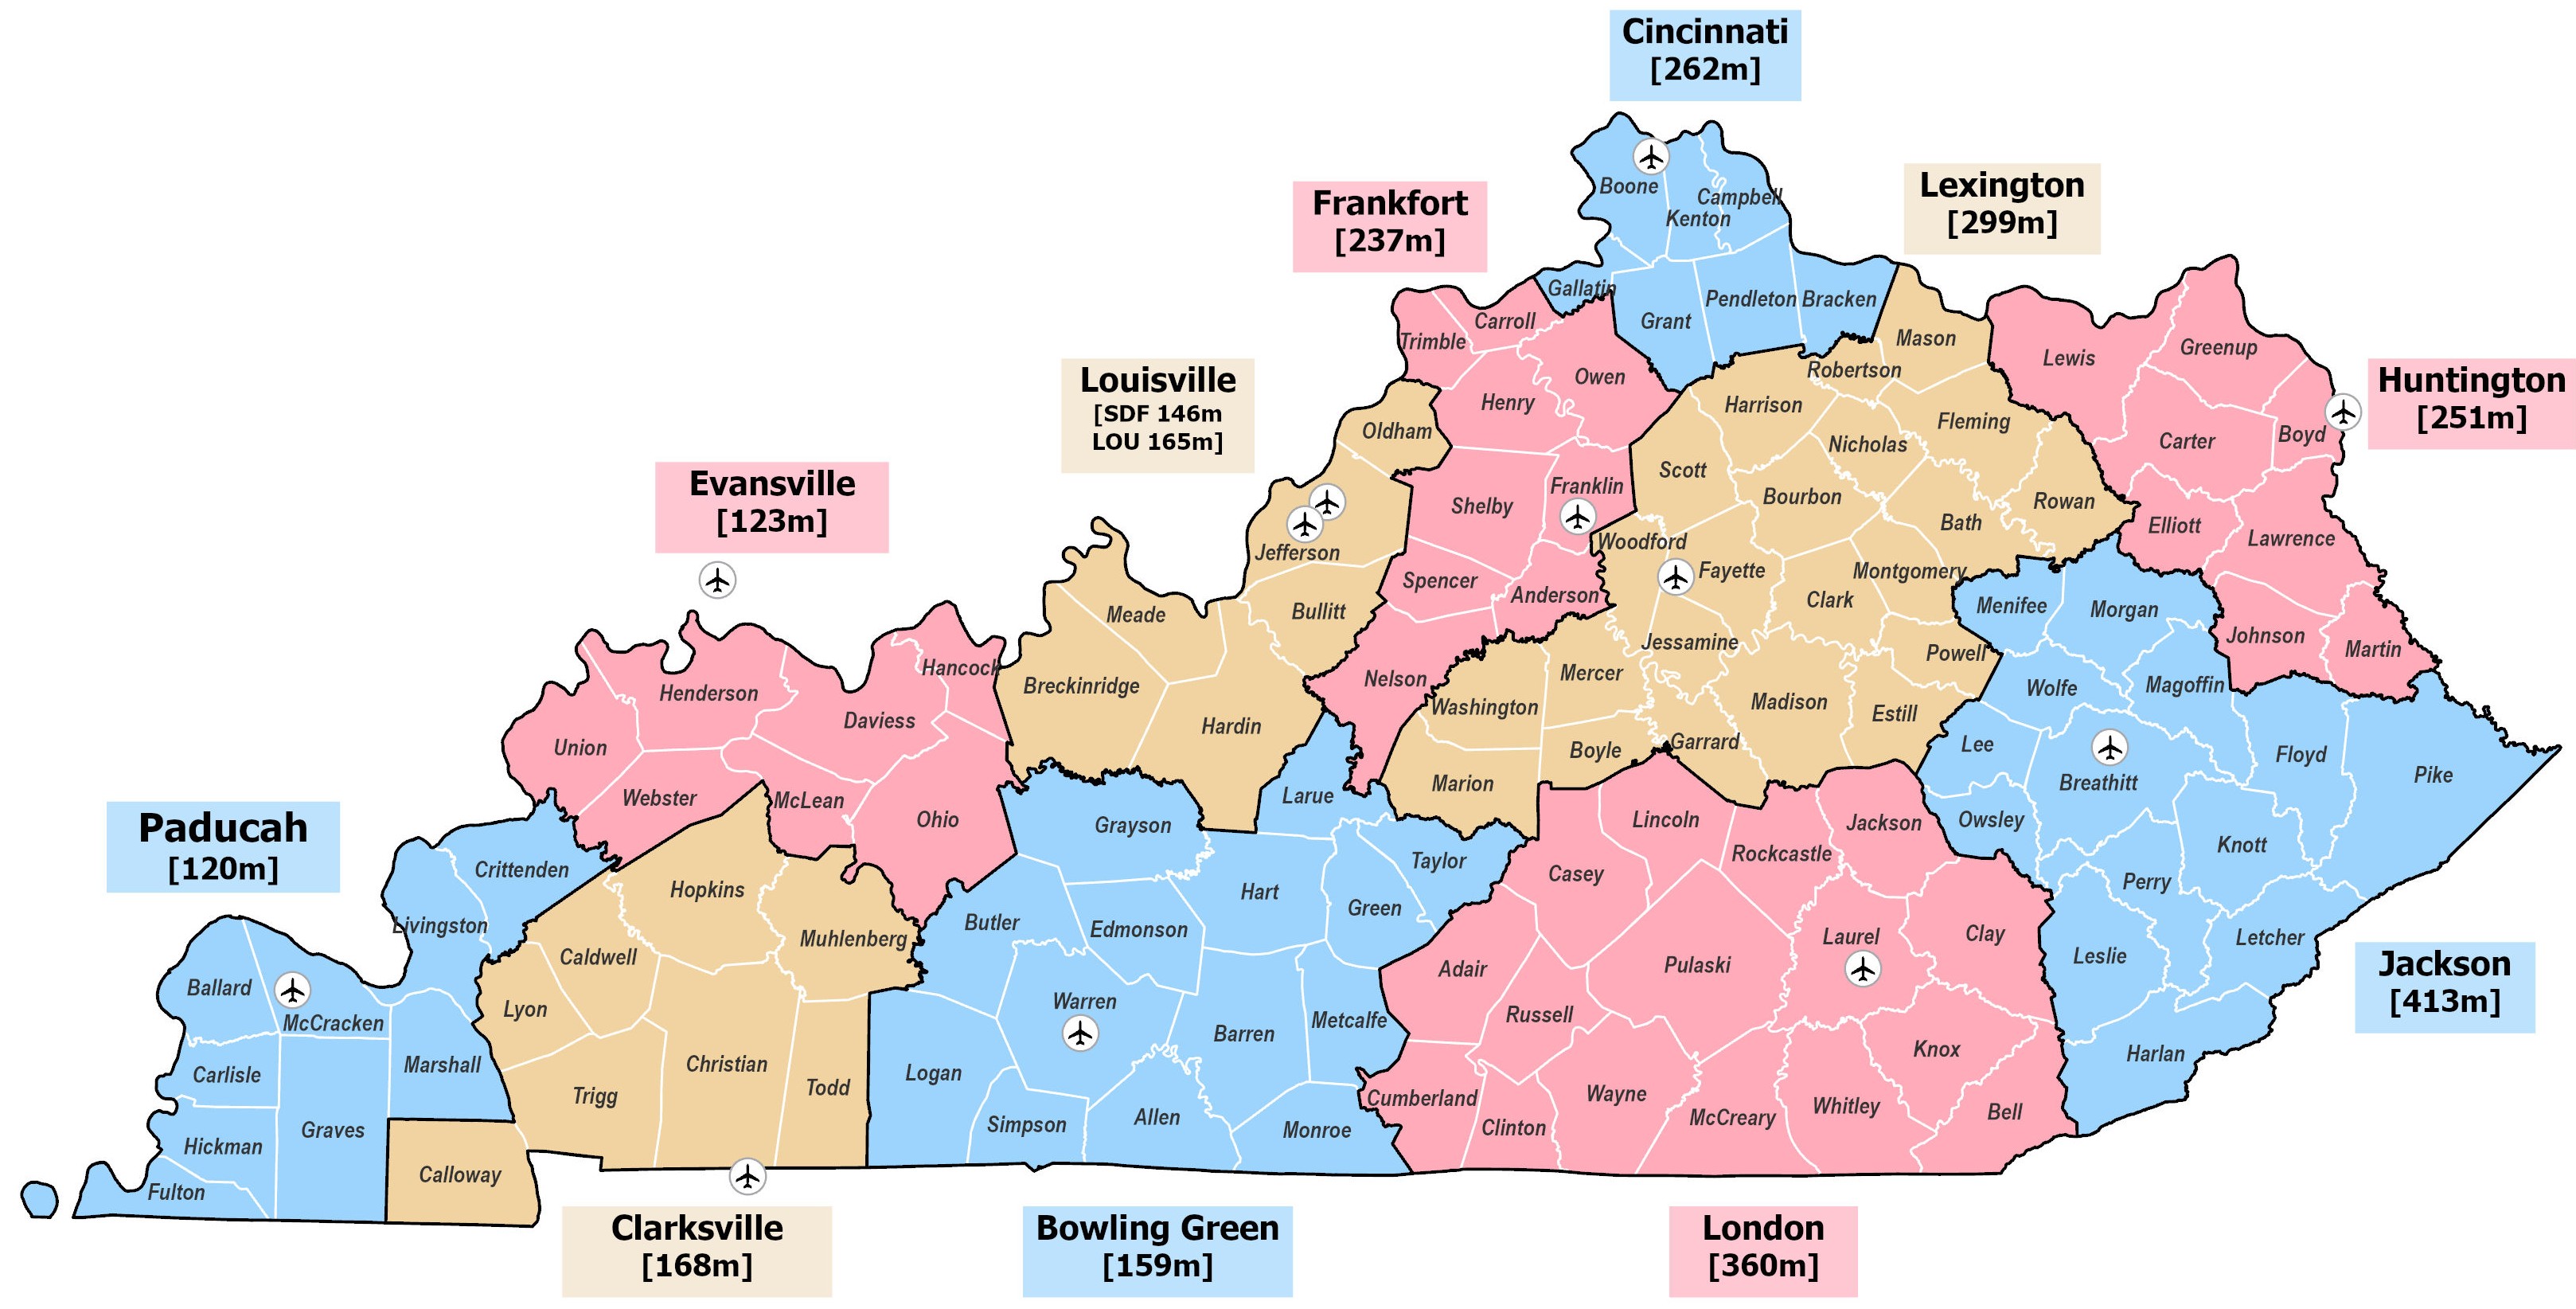
Note: These recommendations are not final and the most representative dataset should always be used with proper justification based on guidance from 40 CFR Part 51 Appendix W. Projection: NAD 1983 UTM Zone 16N. Revised 3/2026 Kyle Ruhl – Kentucky Division for Air Quality.
The recommended airport-county pairings are also listed below:
- Paducah Airport (120 m): Fulton, Hickman, Carlisle, Ballard, McCracken, Graves, Marshall, Livingston, and Crittenden Counties.
- Clarksville Airport (262 m): Calloway, Trigg, Lyon, Caldwell, Hopkins, Christian, Todd, and Muhlenberg Counties.
- Evansville Airport (123 m): Union, Webster, Henderson, Daviess, McLean, Ohio, and Hancock Counties.
- Bowling Green Airport (159 m): Logan, Simpson, Warren, Butler, Grayson, Edmonson, Barren, Allen, Monroe, Metcalfe, Green, Larue, and Taylor Counties.
- Louisville Airports(SDF: 146m, LOU 165 m): Breckinridge, Meade, Hardin, Bullitt, Jefferson, and Oldham Counties.
- Frankfort Airport (237 m): Trimble, Carroll, Henry, Owen, Shelby, Franklin, Spencer, Anderson, and Nelson Counties.
- Cincinnati/Northern Kentucky Airport (262 m): Gallatin, Boone, Grant, Kenton, Campbell, Pendleton, and Bracken Counties.
- Lexington Airport (299 m): Marion, Washington, Mercer, Boyle, Woodford, Jessamine, Garrard, Scott, Fayette, Madison, Harrison, Bourbon, Clark, Estill, Powell, Montgomery, Bath, Rowan, Nicholas, Robertson, Fleming, and Mason Counties.
- Huntington Tri-State Airport (251 m): Lewis, Greenup, Carter, Boyd, Elliot, Lawrence, Johnson, and Martin Counties.
- Jackson Airport (413 m): Menifee, Morgan, Wolfe, Magoffin, Lee, Owsley, Breathitt, Floyd, Pike, Knott, Perry, Leslie, Letcher, and Harlan Counties.
- London Airport (360 m): Adair, Cumberland, Casey, Lincoln, Russell, Clinton, Wayne, Pulaski, Laurel, Jackson, Clay, McCreary, Whitley, Knox, and Bell Counties.
Upper Air Meteorological Data Regions Map
The recommended Kentucky upper air station parings are assigned by the Division based on distance and direction to the upper air balloon release stations. Upper air data is collected daily and provided by the National Weather Service.
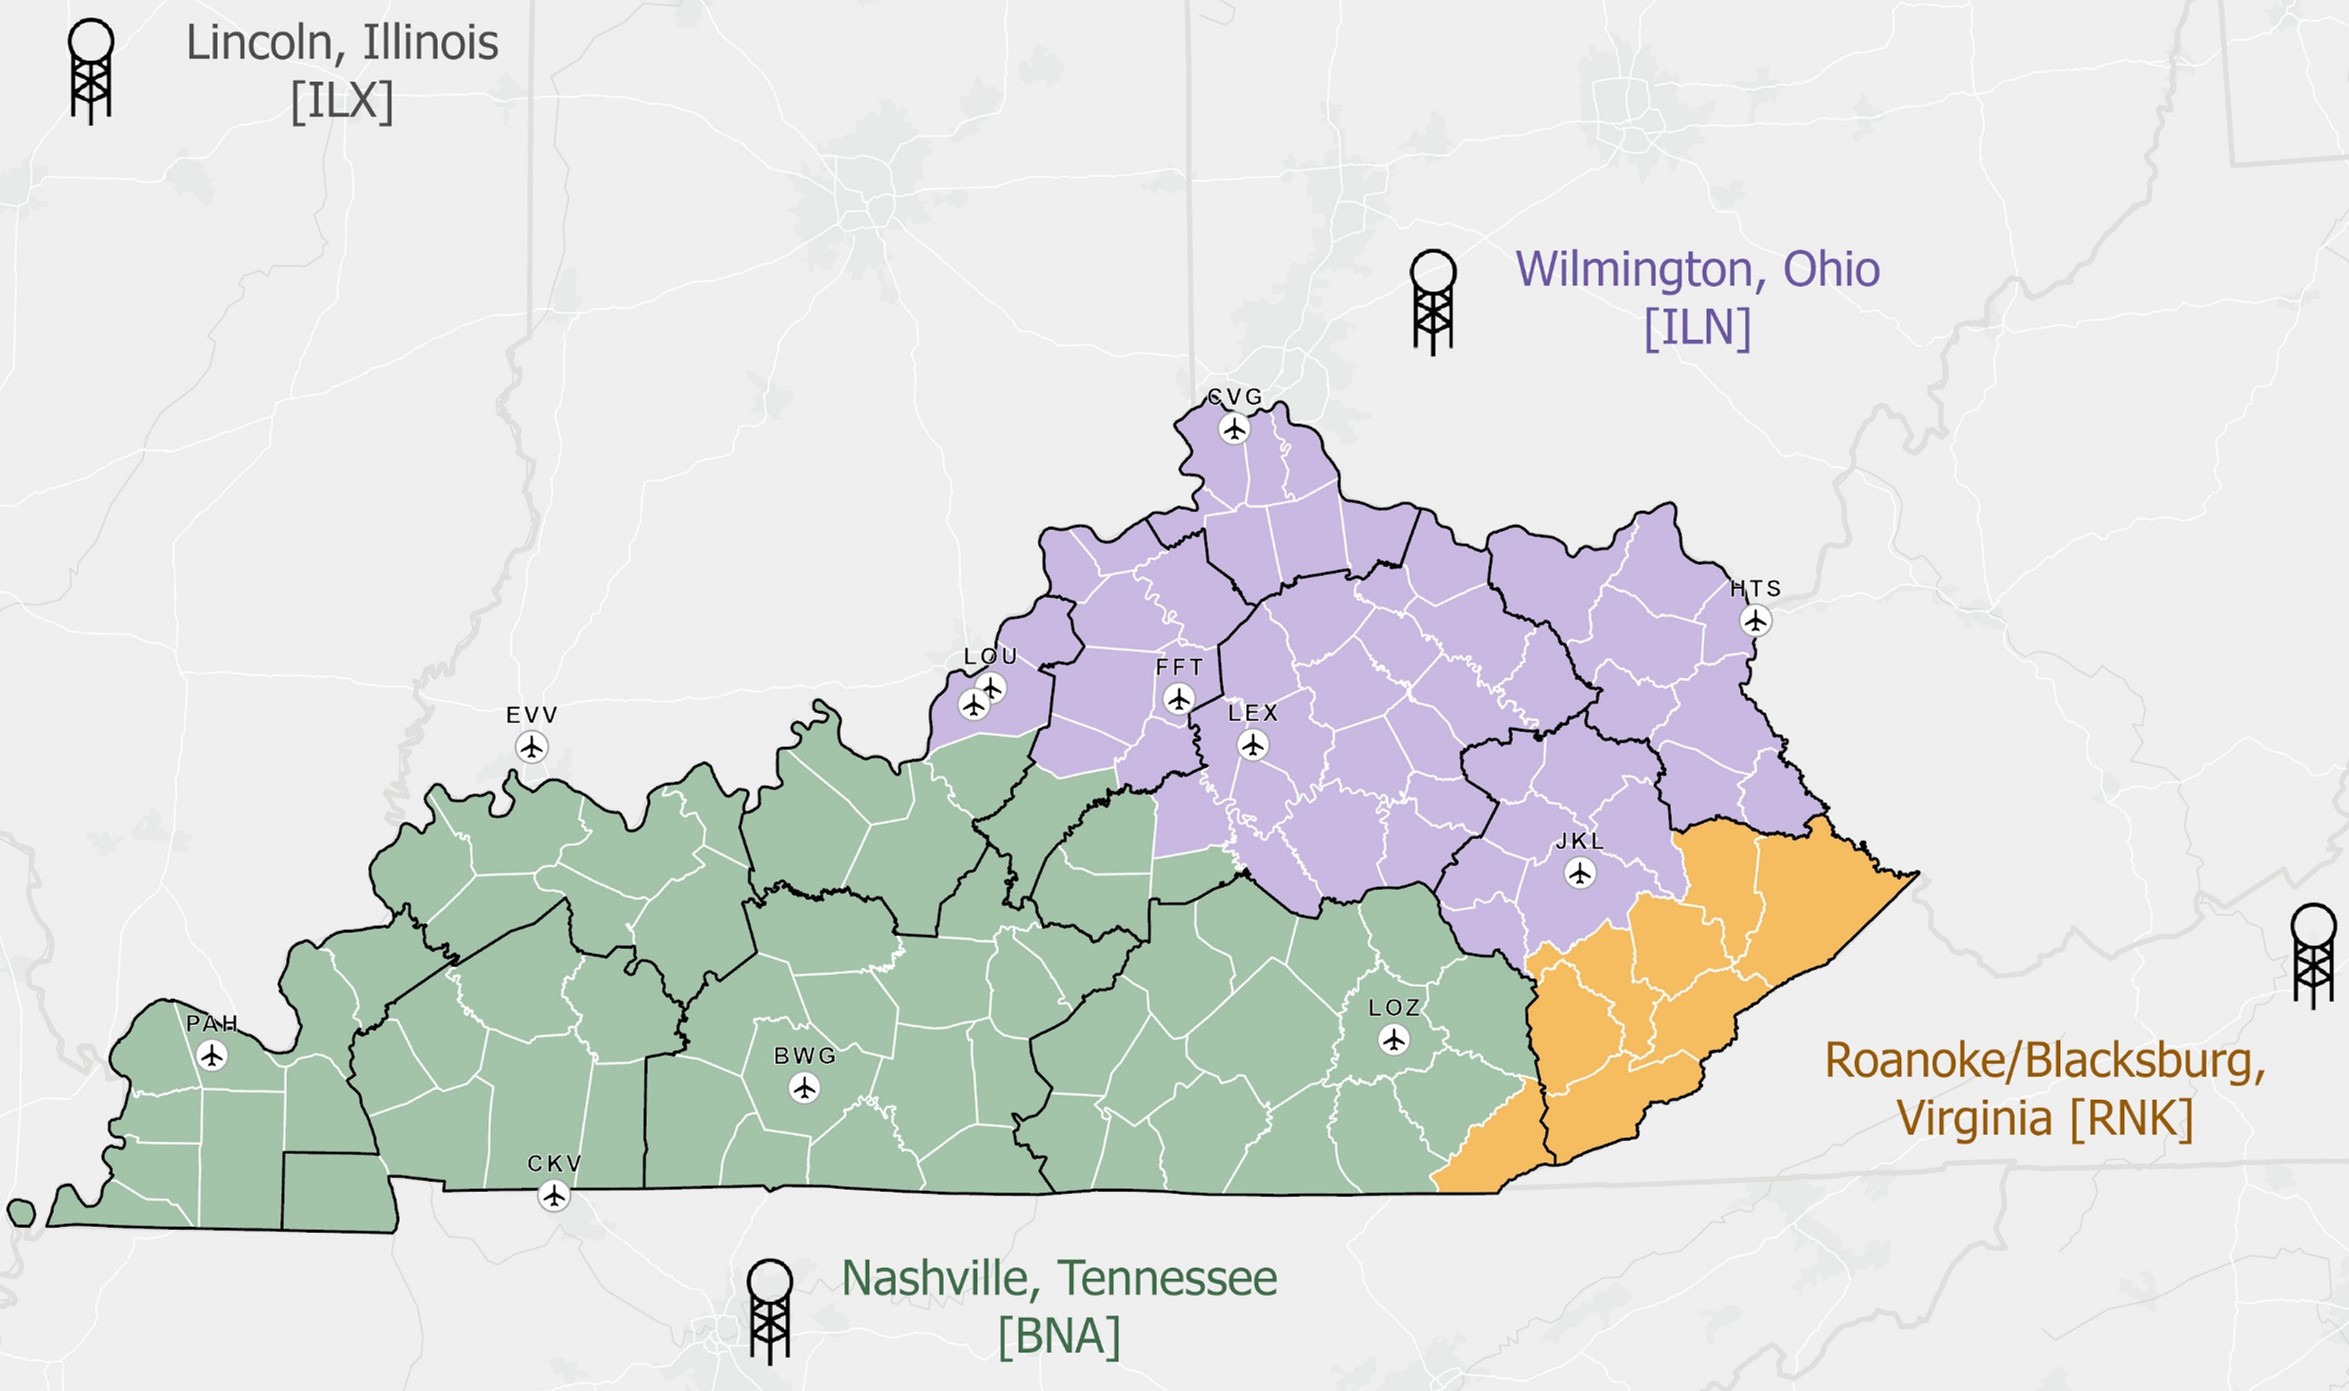
Note: These recommendations are not final and the most representative dataset should always be used with proper justification based on guidance from 40 CFR Part 51 Appendix W. Projection: NAD 1983 UTM Zone 16N. Revised 3/2026 Kyle Ruhl – Kentucky Division for Air Quality.
The recommended upper air station-county pairings are also listed below:
- Nashville, TN Upper Air: Fulton, Hickman, Carlisle, Ballard, McCracken, Graves, Livingston, Marshall, Calloway, Crittenden, Caldwell, Lyon, Trigg, Union, Henderson, Webster, Hopkins, Christian, Daviess, McLean, Muhlenberg, Todd, Hancock, Ohio, Butler, Logan, Meade, Breckinridge, Grayson, Edmonson, Butler, Warren, Logan, Simpson, Allen, Monroe, Barren, Metcalfe, Green, Taylor, Hart, Larue, Hardin, Bullitt, Nelson, Washington, Marion, Boyle, Casey, Adair, Cumberland, Clinton, Russell, Wayne, Pulaski, Lincoln, Rockcastle, McCreary, Whitley, Knox, Clay, Jackson, and Laurel Counties.
- Wilmington, OH Upper Air: Jefferson, Oldham, Trimble, Carrol, Henry, Shelby, Spencer, Gallatin, Owen, Franklin, Anderson, Mercer, Boone, Kenton, Campbell, Grant, Pendleton, Bracken, Scott, Harrison, Robertson, Mason, Lewis, Greenup, Woodford, Fayette, Bourbon, Nicholas, Fleming, Rowan, Carter, Boyd, Lawrence, Elliot, Bath, Montgomery, Clark, Jessamine, Garrard, Madison, Boyle, Marion, Washington, , Powell, Estill, Madison, Lee, Owsley, Breathitt, Magoffin, Johnson, Martin, Lawrence, Elliot, Wolfe, Menifee, and Morgan Counties.
- Roanoke/Blacksburg, VA Upper Air: Bell, Harlan, Leslie, Perry, Letcher, Knott, Floyd, and Pike Counties.
Kentucky Elevation & Land Cover Maps
Statewide elevation and land use maps of Kentucky are provided to assist modelers in identifying representative meteorological stations. Airports with pre-processed data available are indicated by the circle airplane icons. The elevation listed is the meteorological station elevation (in meters).
Kentucky Elevation
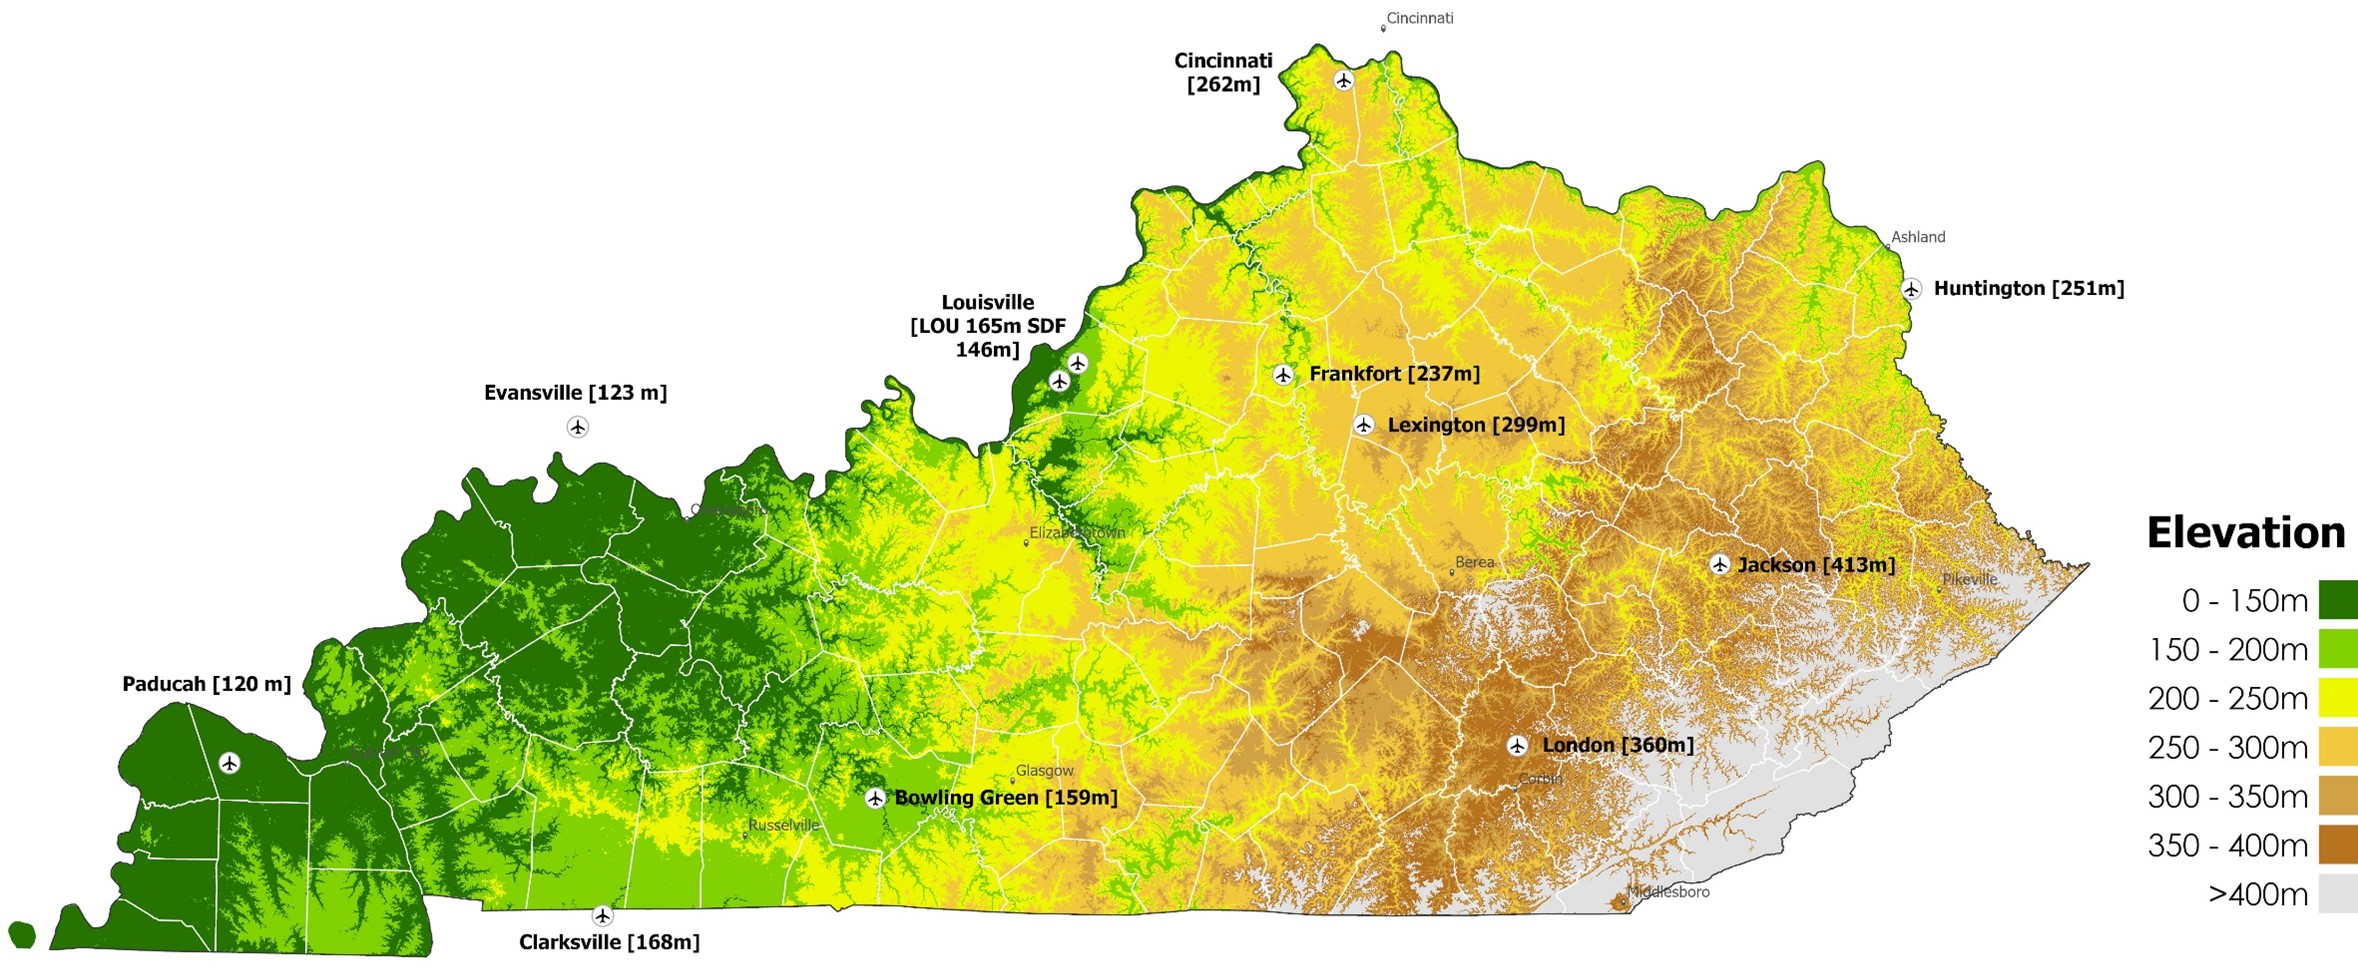
Feature Data: USGS EROS Archive Digital Elevation Shuttle Radar Topography Mission (SRTM) 1 Arc-Second Global Tile Grid. Elevation displayed in meters. Selected elevations represent meteorological station elevations.
Kentucky Land Cover
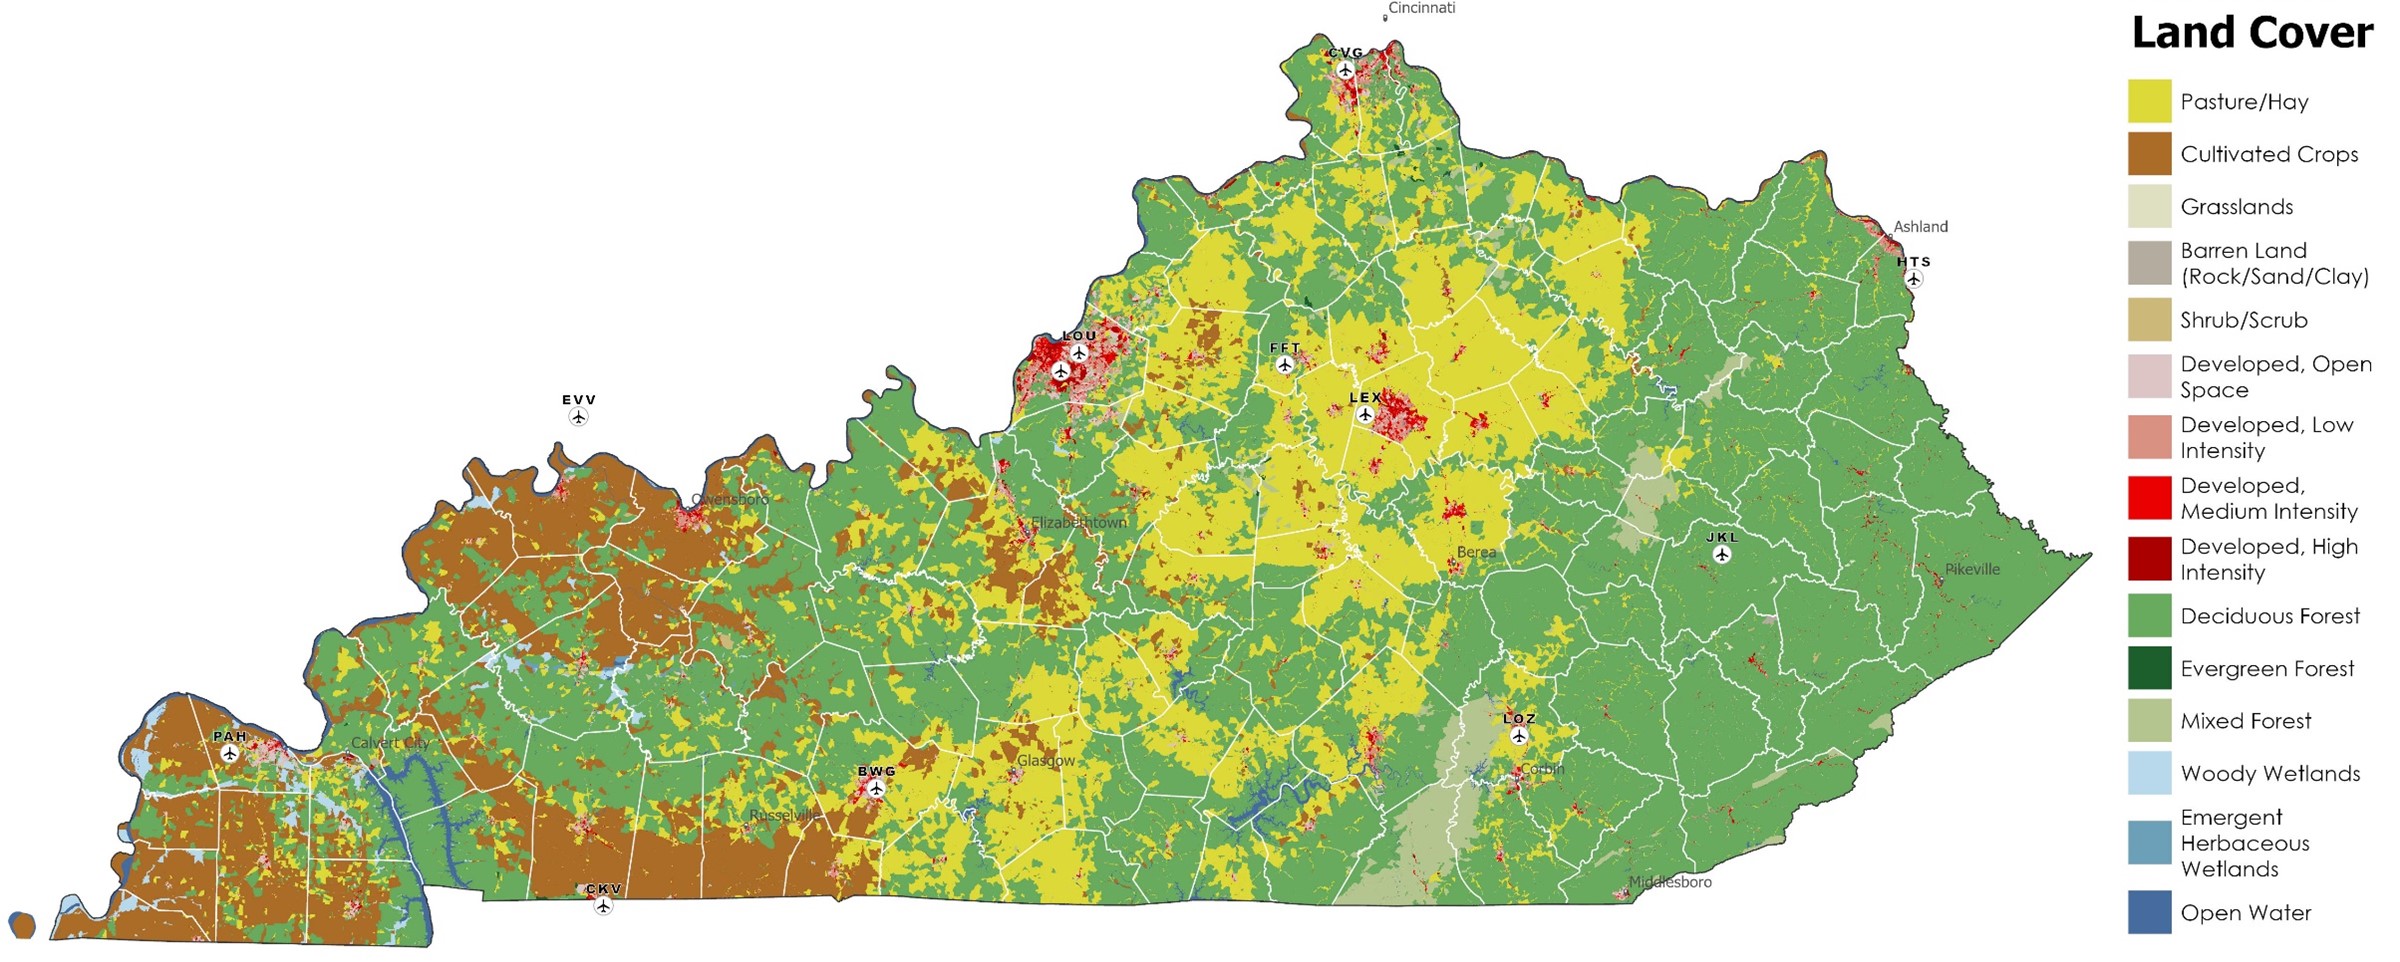
Feature Data: 2021 National Land Cover Data provided by USGS. Land cover data aggregated to 2020 US Census Block level by majority land class characteristic per census-designated block. Projection: NAD 1983 UTM Zone 16N. Revised 3/2026 Kyle Ruhl – Kentucky Division for Air Quality.
Meteorological Data Files 2020-2024
Meteorological data files are available to download using the table below. Each airport zip file contains 5-year model-ready .SFC and .PFL files for relevant combinations of surface and upper air stations in the state. The Kentucky Division for Air Quality updates these files annually using the latest available meteorological data and the most current version of AERMET.
Note: Due to the 8/29/25 discontinuation of the NWS ISHD dataset, the Division is currently unable to provide 2021-2025 datasets. Per EPA recommendations the Division intends to provide updated datasets once the 2026 AERMOD modeling system update is available in the summer of 2026, which should allow for the use of CHCNH data to replace ISHD. For regulatory applications such as permitting that use five years of NWS data, 2020-2024 should be adequate and representative.